Working with LAUS Data
using_get_laus.RmdGeneral Concepts
BLSloadR streamlines access to data from the U.S. Bureau
of Labor Statistics. Its primary benefit is in providing data in a handy
form so that it can be manipulated and used to compare data across
areas, periods, and data types. One simple example includes using the
data across areas to calculate percentiles for a particular data element
to compare a single state to the range of experiences across other
states.
Step 1: Accessing the Data
Accessing data from the BLS is simple. Here, we can use
get_laus() to pull up the Local Area Unemployment
Statistics (LAUS) data. By default, this will pull seasonally-adjusted
data at the statewide level.
# Get the LAUS data using BLSloadR
bls_import <- get_laus()

head(bls_import,10)
#>                series_id   year period value area_type_code       area_code
#>                   <char> <char> <char> <num>         <char>          <char>
#>  1: LASST010000000000003   1976    M01 0.067              A ST0100000000000
#>  2: LASST010000000000003   1976    M02 0.066              A ST0100000000000
#>  3: LASST010000000000003   1976    M03 0.066              A ST0100000000000
#>  4: LASST010000000000003   1976    M04 0.065              A ST0100000000000
#>  5: LASST010000000000003   1976    M05 0.064              A ST0100000000000
#>  6: LASST010000000000003   1976    M06 0.065              A ST0100000000000
#>  7: LASST010000000000003   1976    M07 0.065              A ST0100000000000
#>  8: LASST010000000000003   1976    M08 0.067              A ST0100000000000
#>  9: LASST010000000000003   1976    M09 0.068              A ST0100000000000
#> 10: LASST010000000000003   1976    M10 0.069              A ST0100000000000
#>     measure_code seasonal srd_code area_text      measure_text       date
#>           <char>   <char>   <char>    <char>            <char>     <Date>
#>  1:           03        S       01   Alabama unemployment rate 1976-01-01
#>  2:           03        S       01   Alabama unemployment rate 1976-02-01
#>  3:           03        S       01   Alabama unemployment rate 1976-03-01
#>  4:           03        S       01   Alabama unemployment rate 1976-04-01
#>  5:           03        S       01   Alabama unemployment rate 1976-05-01
#>  6:           03        S       01   Alabama unemployment rate 1976-06-01
#>  7:           03        S       01   Alabama unemployment rate 1976-07-01
#>  8:           03        S       01   Alabama unemployment rate 1976-08-01
#>  9:           03        S       01   Alabama unemployment rate 1976-09-01
#> 10:           03        S       01   Alabama unemployment rate 1976-10-01
Here we can see that while we have a series of data, it has a number of columns that do not do us much good. In order to pivot and compare the data easily, we need to drop items like the series_id to ensure that we do not have too many identifiers in the series.
Step 2: Renaming, Filtering, and Narrowing the Table
Next, we will rename some columns, select only those that clarify the values we need, and assign R-friendly column names to the data to make it easier to work with. This will allow us to pivot the data, allowing for easier manipulation of the columns.
bls_state_table <- bls_import |>
  rename("state" = "area_text",
         "measure" = "measure_text") |>
  filter(state != "Puerto Rico") |>
  select(date, state, measure, value) |>
  pivot_wider(names_from = measure, values_from = value) |>
  rename("ur" = "unemployment rate",
         "unemployment" = "unemployment",
         "employment" = "employment",
         "labor_force" = "labor force",
         "epr" = "employment-population ratio",
         "lfpr" = "labor force participation rate")

head(bls_state_table,10)
#> # A tibble: 10 × 8
#>    date       state      ur unemployment employment labor_force   epr  lfpr
#>    <date>     <chr>   <dbl>        <dbl>      <dbl>       <dbl> <dbl> <dbl>
#>  1 1976-01-01 Alabama 0.067        98903    1387606     1486509 0.533 0.571
#>  2 1976-02-01 Alabama 0.066        98677    1387267     1485944 0.532 0.569
#>  3 1976-03-01 Alabama 0.066        97869    1388303     1486172 0.531 0.568
#>  4 1976-04-01 Alabama 0.065        96761    1392012     1488773 0.531 0.568
#>  5 1976-05-01 Alabama 0.064        96242    1396244     1492486 0.532 0.568
#>  6 1976-06-01 Alabama 0.065        96744    1400036     1496780 0.532 0.569
#>  7 1976-07-01 Alabama 0.065        98225    1402922     1501147 0.532 0.569
#>  8 1976-08-01 Alabama 0.067       100273    1405216     1505489 0.532 0.57
#>  9 1976-09-01 Alabama 0.068       102302    1407784     1510086 0.532 0.571
#> 10 1976-10-01 Alabama 0.069       104185    1410640     1514825 0.532 0.572
Step 3: Calculating Summary Statistics
Because we have access to the full time series for all states, we can move away from comparing a single state to only the national trend. Instead, we can compare state-to-state, which allows for more nuanced context showing how common or uncommon a single state’s experience is across the nation. Here, we calculate the 20th, 50th (median), and 80th percentiles.
bls_state_table <- bls_state_table |>
  pivot_longer(3:8, names_to = "measure", values_to = "value") |>
  group_by(date, measure) |>
  mutate(
    pct_20 = quantile(value, 0.2, na.rm = TRUE),
    pct_80 = quantile(value, 0.8, na.rm = TRUE),
    median = median(value, na.rm = TRUE)
  ) |>
  ungroup()

head(bls_state_table,10)
#> # A tibble: 10 × 7
#>    date       state   measure            value     pct_20      pct_80     median
#>    <date>     <chr>   <chr>              <dbl>      <dbl>       <dbl>      <dbl>
#>  1 1976-01-01 Alabama ur                 0.067      0.058       0.092    6.7 e-2
#>  2 1976-01-01 Alabama unemployment   98903      29410      187753        9.50e+4
#>  3 1976-01-01 Alabama employment   1387606     364957     2426320        1.20e+6
#>  4 1976-01-01 Alabama labor_force  1486509     390460     2595504        1.30e+6
#>  5 1976-01-01 Alabama epr                0.533      0.554       0.618    5.84e-1
#>  6 1976-01-01 Alabama lfpr               0.571      0.597       0.653    6.31e-1
#>  7 1976-02-01 Alabama ur                 0.066      0.058       0.092    6.6 e-2
#>  8 1976-02-01 Alabama unemployment   98677      29414      187838        9.50e+4
#>  9 1976-02-01 Alabama employment   1387267     364611     2425263        1.20e+6
#> 10 1976-02-01 Alabama labor_force  1485944     390099     2594800        1.30e+6
Step 4: Narrowing the Data for Display
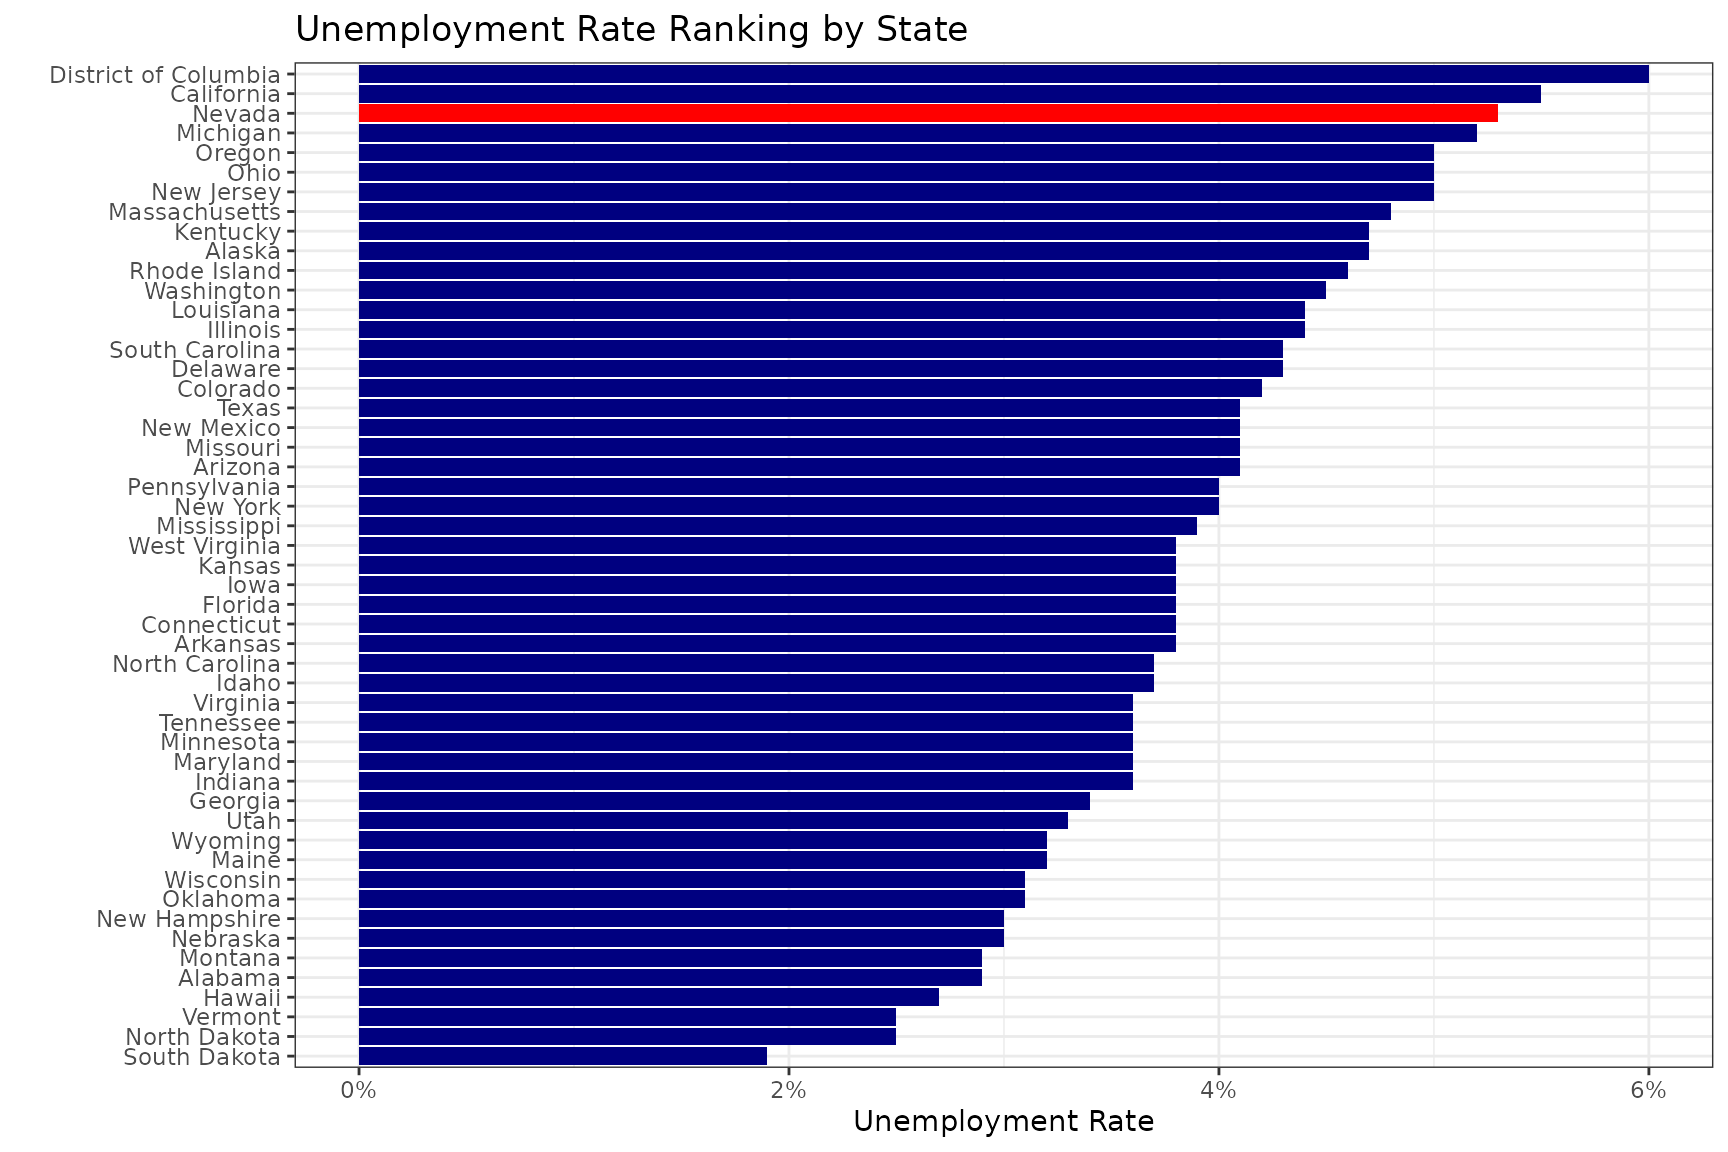
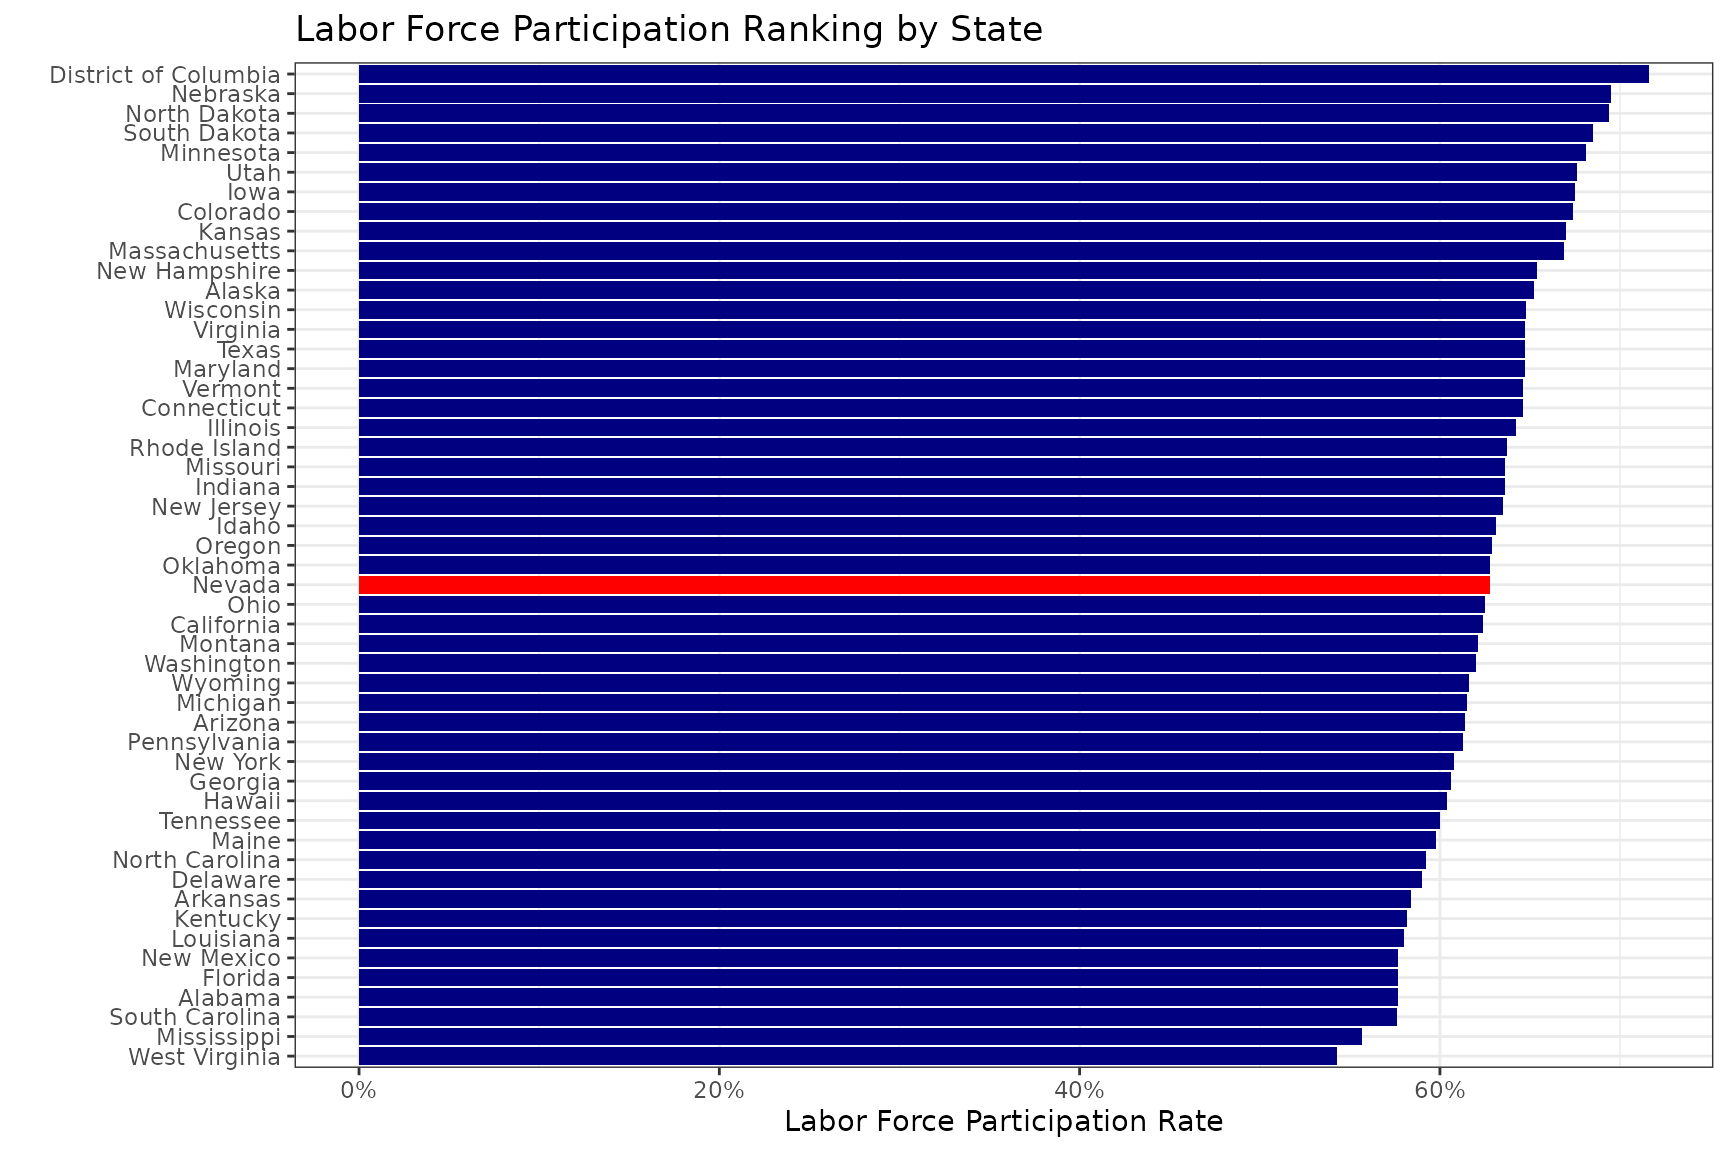
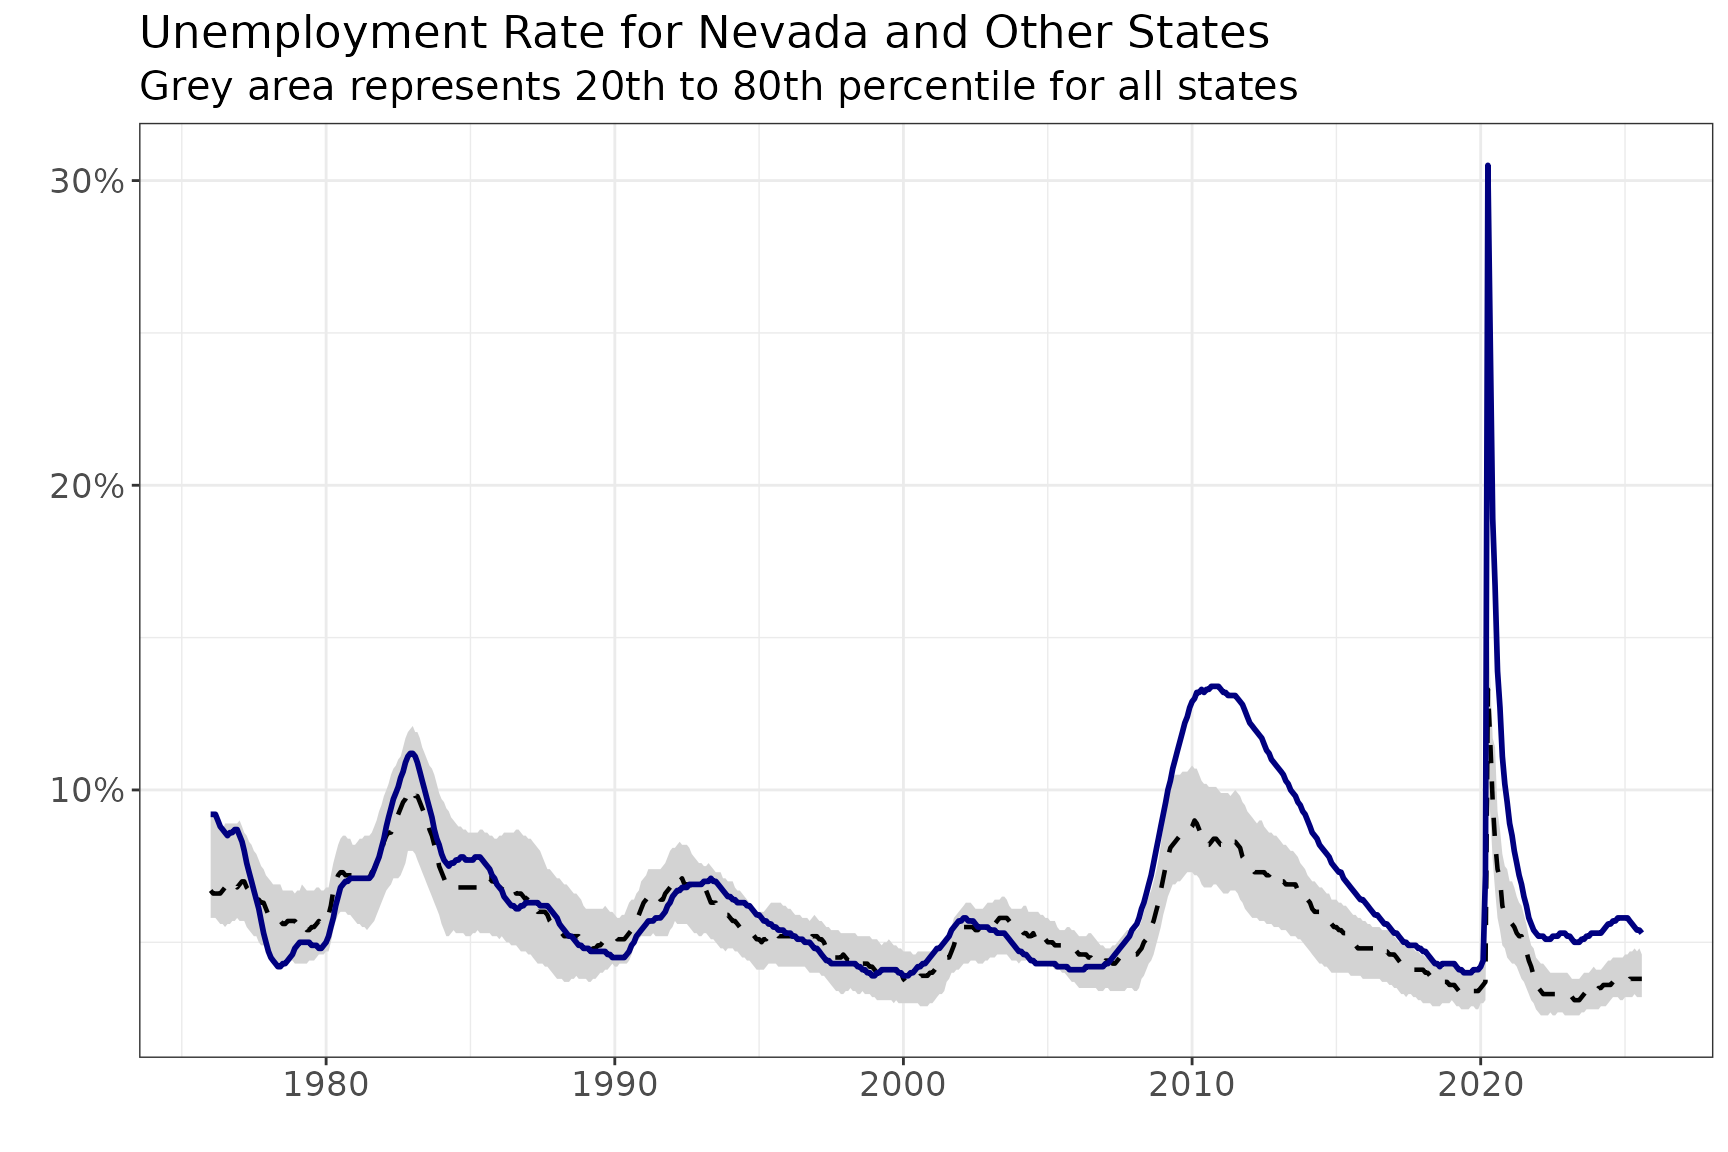
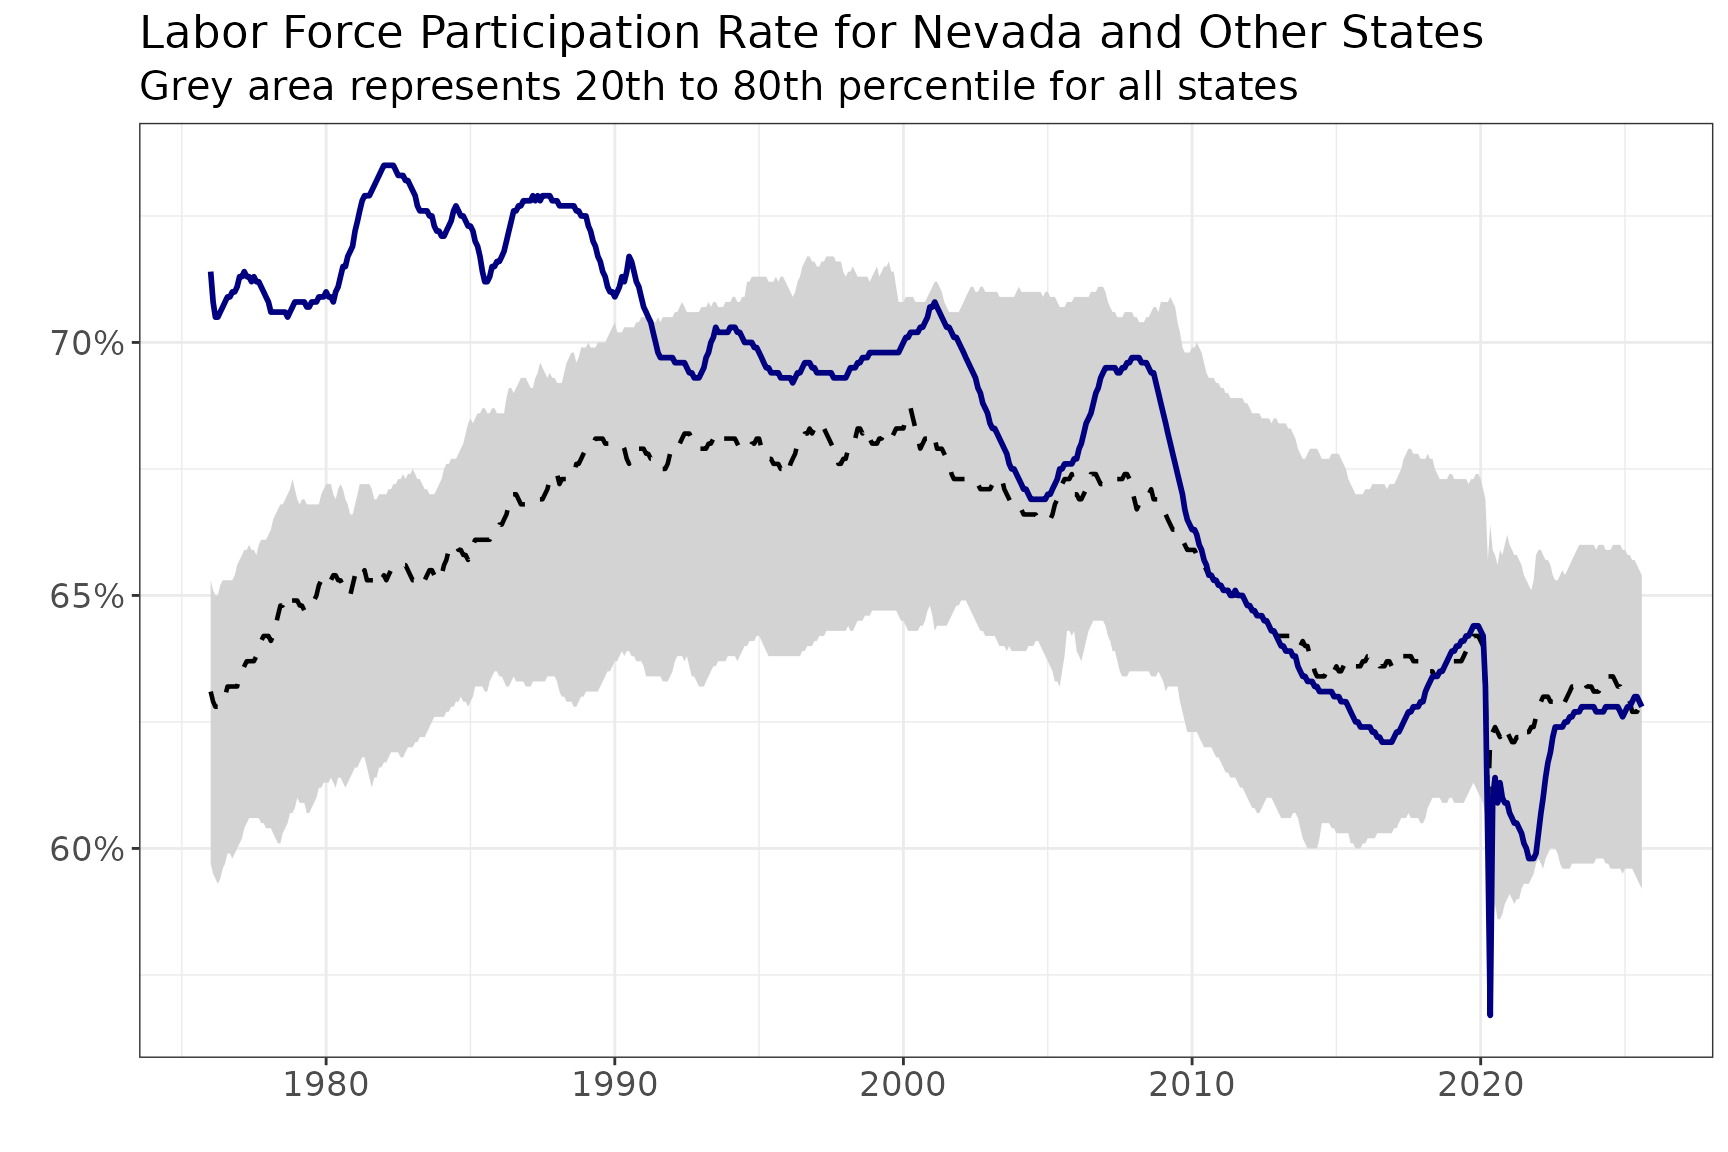
Since we now have comparative measures across the states, we can start looking at what we want to compare. Here, we will look at four options: a national ranking of the current Unemployment Rate and the current Labor Force Participation Rate, and a comparison of the trend for a single state to the range of experiences for other states over time for each of those measures. We will also add a column to highlight Nevada, the state we are interested in highlighting.
selected_state <- "Nevada"

bls_current <- bls_state_table |>
  filter(date == max(date)) |>
  mutate(is_st = if_else(state == selected_state, TRUE, FALSE))

bls_ts <- bls_state_table |>
  filter(state == selected_state)
Unemployment Rate Chart
bls_current |>
  filter(measure == "ur") |>
  ggplot() +
  geom_col(aes(x = value, y = reorder(state, value), fill = is_st)) +
  scale_fill_manual(values = c("navy","red")) +
  scale_x_continuous(labels = scales::percent) +
  labs(x = "Unemployment Rate", y = "", title = "Unemployment Rate Ranking by State") +
  theme_bw() +
  theme(legend.position = "none")
Labor Force Participation Rate Chart
bls_current |>
  filter(measure == "lfpr") |>
  ggplot() +
  geom_col(aes(x = value, y = reorder(state, value), fill = is_st)) +
  scale_fill_manual(values = c("navy","red")) +
  scale_x_continuous(labels = scales::percent) +
  labs(x = "Labor Force Participation Rate", y = "", title = "Labor Force Participation Ranking by State") +
  theme_bw() +
  theme(legend.position = "none")
Unemployment Rate Over Time
bls_ts |>
  filter(measure == "ur") |>
  ggplot(aes(x = date)) +
  geom_ribbon(aes(ymin = pct_20, ymax = pct_80), fill = "lightgrey") +
  geom_line(aes(y = median), color = "black", linetype = "dashed", linewidth = 0.8) +
  geom_line(aes(y = value), color = "navy", linewidth = 1) +
  labs(title = "Unemployment Rate for Nevada and Other States",
       subtitle = "Grey area represents 20th to 80th percentile for all states",
       y = "", x = "") +
  scale_y_continuous(labels = scales::percent_format(accuracy = 1)) +
  theme_bw() +
  theme(
    axis.text = element_text(size = 13),
    plot.title = element_text(size = 17),
    plot.subtitle = element_text(size = 15)
  )
Labor Force Participation Rate Over Time
bls_ts |>
  filter(measure == "lfpr") |>
  ggplot(aes(x = date)) +
  geom_ribbon(aes(ymin = pct_20, ymax = pct_80), fill = "lightgrey") +
  geom_line(aes(y = median), color = "black", linetype = "dashed", linewidth = 0.8) +
  geom_line(aes(y = value), color = "navy", linewidth = 1) +
  labs(title = "Labor Force Participation Rate for Nevada and Other States",
       subtitle = "Grey area represents 20th to 80th percentile for all states",
       y = "", x = "") +
  scale_y_continuous(labels = scales::percent_format(accuracy = 1)) +
  theme_bw() +
  theme(
    axis.text = element_text(size = 13),
    plot.title = element_text(size = 17),
    plot.subtitle = element_text(size = 15)
  )